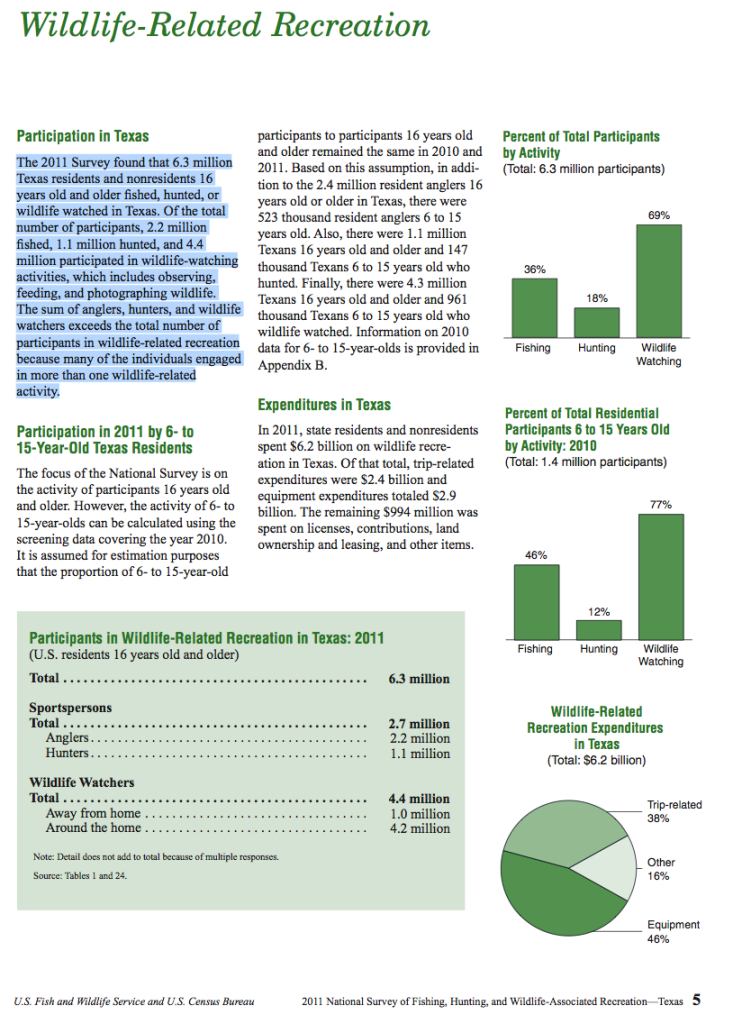
Economic data for nature tourism is often challenging to obtain as the term is very broad and there seems to be little standardized data collection that identifies local impacts. As a major component of the travel and tourism industry as a whole, nature based tourism economic impacts are significant and local data is usually obtained through targeted primary data collection studies.
The primary regular national study that includes state level assessments is that USFW Study described below. It should be noted that this study only address WILDLIFE activities and not NATURE activities. By this we mean that activities that are not specifically and primarily motivated by wildlife experiences are not part of this study. For example, going to the beach, hiking in the mountains, staying as a lake cabin, or rafting or paddling. This activities are nature based but not wildlife focused. These activities are generally captured in data on travel and tourism in general.
National Survey of Fishing, Hunting, and Wildlife-Associated Recreation
Click here to download a PDF copy of the USFWS 2011 National Survey
State-Level Estimates for Texas
Click here to download a PDF copy of the USFWS 2011 State Report
National Data
In 2011, 90.1 million Americans, 38% of the U.S. population 16 years old and older, enjoyed some form of fishing, hunting or wildlife-associated recreation. Outdoor recreation is a huge contributor to our nation’s economy.
Expenditures by hunters, anglers and wildlife recreation enthusiasts were $145.0 billion.
This equates to 1% of gross domestic product; meaning one out of every one hundred dollars of all goods and services produced in the U.S. is due to wildlife related recreation. Almost 37.4 million Americans participated in fishing, hunting or both sports in 2011.
These sportsmen and women spent $43.2 billion on equipment, $32.2 billion on trips, and $14.6 billion on licenses and fees, membership dues and contributions, land leasing and ownership, and plantings for hunting. On average, each sportsperson spent $2,407 in 2011.
They spent over $145 billion pursuing their recreational activities, contributing to millions of jobs in industries and businesses that support wildlife-related recreation.
Funds generated by licenses and taxes on hunting and fishing equipment pay for many of the conservation efforts in this country and provide many hours of fishing, hunting, and wildlife watching.
Click here to download a copy of the 2011 National Survey of Fishing, Hunting, and Wildlife-Associated Recreation State Overview (comprehensive of all states, issued September 2012.)
The reports/data are organized by survey year and are available for download, 2011 reports, 2006 reports, 2001 reports, 1996 reports, and 1991 reports. The 2011 National Survey reports will be available only in a pdf format and not printed. They will be posted on our website as they become available.
Click here to download a PDF copy of the 2011 National Survey of Fishing, Hunting and Wildlife Associated Recreation report.
Click here for additional information available from research and reports by the Outdoor Industry Association on outdoor recreation.


